Physical connectors with self-aligning geometry aid in the docking process for many robotic and automatic control systems such as robotic self-reconfiguration and air-to-air refueling. This self-aligning geometry provides a wider range of acceptable error tolerance in relative pose between the two rigid objects, increasing successful docking chances. A new, more discrete flooding method for analyzing the area of acceptance or AA (a measure of error tolerance) of these connectors is presented. The new method saves nearly two orders of magnitude of computational time, obtaining results for the same 2D connector pair 14 times faster with 8 times more resolution in rotation, at the cost of discretizing the translation direction. These significant time savings make it feasible to perform higher-dimensional analysis of connector pairs. We also present results on higher dimensional subspaces of 3D connectors – namely, (x,y,yaw), (x,roll,pitch), etc. With this method we can speed up the process of finding metrics for self-aligning mechanical connectors for robotic systems, enabling superior alignment performance.
Discrete Configuration Space Representation
The method is based on the configuration space obstacle model, which gives us a representation of the space of contact states between the two objects. Using an approach direction as analogous to gravity, and assuming the target docked configuration is stable, the set of misaligned points that lead to docking is the target configuration’s watershed for an arbitrarily dimensioned configuration space obstacle. It is well known that the watershed of a height map on a discrete grid can be found using any number of algorithms from image segmentation. We present an implementation based on Meyer’s flooding algorithm to determine this watershed and measure the AA for simple connectors in 2D and 3D. Results are presented for systems including unconstrained motion in SE(2) and motion constrained to four dimensions (ie. x,y,z,pitch) in SE(3).
For more information on Configuration Space approaches and the Area of Acceptance metric, see:
Modular Robot Connector Acceptance by Configuration Space Analysis
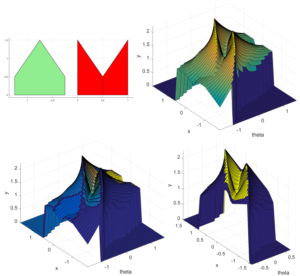
The configuration space generation step is sped up by not having to knit various slices into a higher-dimensional polytope, and instead simply perform Minkowski sum in translation and sample. This is repeated for each rotational space desired until the full grid space is populated.
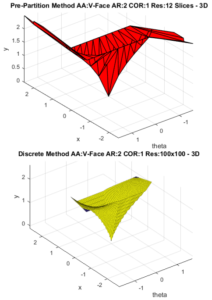
Figure 1
The increased fidelity of this representation increases the likelihood of more accurate determination of the area of acceptance.
Watershed Method by Flooding Algorithm
Once we have the points in a grid, any number of methods from the image segmentation literature can be applied to find the watershed. Here we use an algorithm similar to Meyer’s flooding algorithm. Neighbors are considered 8-connected in the 2D case and 26-connected in the 3D case.
The algorithm is as follows:
- The grid is searched for local minima.
- Unique neighbors of each minimum are placed into a priority queue based on height.
- The lowest point in the queue is labelled based on it’s neighbors – if all have the same watershed value it assumes that value otherwise it is a ‘dam’
- All non-marked neighbors are added to the queue.
- Continue to assign values as in 3) until all points have values assigned.
Once this is completed, a ‘merging’ step is performed to prevent over-segmentation, which can happen in certain ill-conditioned cases such as in the example below:
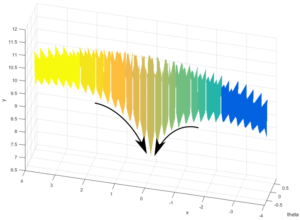
Here, a thin narrow canyon is less than the sampling resolution, resulting in an oversampling into over 10 different watershed assignments, when really this should be 3 or 4. Merging by depth of watershed, we are able to counteract this over-segmentation as is standard for image segmentation.
This algorithm is demonstrably faster than the previous pre-partitioning method especially in combination with the time savings generating the configuration space representation. For one connector pair, the previous method computed the AA with the rotation dimension discretized into 12 ‘slices’, running for 48.6 minutes, while the new flooding method discretizes the space into 100×100 translation by rotation points and runs in 3.18 minutes. These two representations are described above and shown in Figure 1 for comparison (area outside the determined area of acceptance not shown).
Results
The algorithm was run for two different 2D connectors (the V-Face and X-Face) over the same set of design parameters (aspect ratio AR and center of rotation COR) as in the previous works.
Examples of design parameters:
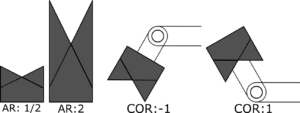
Results show that the sum total area of the AA shape for these two connectors trends positive with positive COR, as is expected from results on other problems in the field such as peg-in-hole. AR has a more complicated relationship with AA, and depends on the particular face and COR, as can be seen in the tables below.

The results in blue are the only values with vary significantly from the previously found results. These results are <10% of the values found previously, probably due to the improved resolution resulting in less ‘false positive’ area. These are all in the high-AR negative-COR range which is particularly bad for 2D connectors.
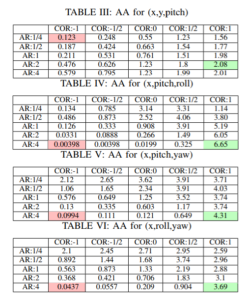
3D results were generated for the ‘3D pyramid’ connector shown below, and performed over the same range of design parameters but in several subspaces (ie. x,y,pitch) of the full offset dimensions (x,y,roll,pitch,yaw). The (x,y,roll) subspace is excluded because of its symmetry with (x,y,pitch). The (x,y,yaw) subspace does not vary with design parameters and in every case has the value 2.47. Red entries are the lowest values found and green are the highest. High values trend towards a combination of high-AR/high-COR, though if the COR is restricted to lower values, lower AR is often better for area of acceptance with a higher value. All values are dimensionless; translation dimensions are changed to distance/connector width D, rotation dimensions are in radians.
Conclusion
The method presented involves a new algorithm for finding area of acceptance that improves computation time significantly, enabling higher-dimensional analysis. This algorithm was tested and compared to previous 2D results as well as used to find results on subsets of the 3D connector set for the first time. Trends in 3D connectors are shown and analyzed – positive centers of rotation and aspect ratio combined correlate strongly with high AA. However if the COR is restricted to be negative, less positive aspect ratios are favored.
Publications
This work was presented at the 2018 IEEE/RSJ International Conference on Intelligent Robots and Systems. Citations and pre-published material will be added as it becomes available.
Pingback:nagaway สล็อต เว็บตรง
Pingback:gay bdsm málaga
Pingback:Trustbet
Pingback:ข่าวบอล
Pingback:뉴토끼
Pingback:ai nude
Pingback:ดูซีรี่ย์ออนไลน์
Pingback:hfm ดีไหม
Pingback:rich89bet
Pingback:unieke reizen
Pingback:sex women
Pingback:Project Mancave
Pingback:ชอบหีสวย.com
Pingback:concrete patio
Pingback:pakkumised ja teenused
Pingback:พูลวิลล่า
Pingback:ตู้ลำโพง
Pingback:dultogel
Pingback:Winchester guns
Pingback:รักษาสิว
Pingback:PBT
Pingback:สล็อต เครดิตฟรี
Pingback:Winbet7 Casino
Pingback:บริษัทรับทำเว็บไซต์
Pingback:Volnewmer
Pingback:Sylfirm
Pingback:wps下载
Pingback:wps下载
Pingback:โบท็อกราคา
Pingback:poker
Pingback:hit789
Pingback:รับทำ SEO
Pingback:klik dultogel
Pingback:รับจำนำรถใกล้ฉัน
Pingback:diamond price calculator
Pingback:thailand tattoo
Pingback:Sevink Molen
Pingback:best cams
Pingback:ทดลองเล่นสล็อต ฟรี
Pingback:Albino Penis Envy Mushroom Psilocybin
Pingback:packs disposable thc vape
Pingback:rich89bet
Pingback:Engineering Technicians
Pingback:lottorich28
Pingback:HArmonyCa
Pingback:แทงบอลออนไลน์เกาหลี